Gender Pay Gap Report 2019
Under the Equality Act 2010 (Specific Duties and Public Authorities) Regulations 2017, all public authorities in England with 250 or more employees are required to report their gender pay gap data annually.
The Gender Pay Gap data provides the difference between the average earnings of men and women across an organisation, expressed as a percentage of men’s earnings. The use of Gender Pay Gap data can help to identify the extent to which men and women undertake different types of roles, at different levels within the organisation, which can also create differences in pay. It is different to equal pay data which considers rates of pay for the same level of work.
The University’s long-term commitment to equality and inclusivity is reflected in our Gender Pay Gap data. Over the last two years, we have reported the lowest Gender Pay Gap in the Higher Education Sector. This year, the median pay gap is -1%, when student employees are removed from the Gender Pay Gap calculation (students have the opportunity to undertake work at the University through our ‘earn as you learn’ scheme which has been very successful in preparing students for employment after completing their studies).
The data provided below relates to University of Worcester’s Gender Pay Gap report for 2019 taken on the snapshot date of 31 March 2019.
Employment mix within the pay quartiles
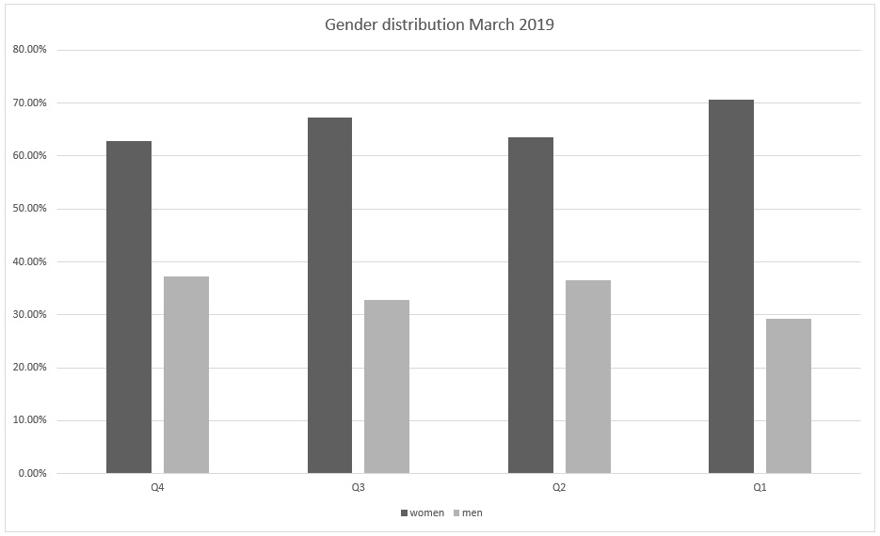
The quartile data (the split of employees into four groups by hourly rate, to show the balance of men and women in each group), shows that women account for over 62% of employees across all four quartiles. This data is indicative of the University’s inclusive approach in all areas of work and the value it places on female employees at all levels.
This year’s report showed a small increase in female employees in Quartile 1, with a greater number of students choosing to undertake paid work within the University as ‘earn and you learn’ scheme. As 70% of our students are female, it is inevitable that this gender split will have some impact on the overall data, especially when, during this year, student employees accounted for 9% of the University’s workforce. An additional report has been compiled to show what our gender pay gap data would be without the effect of this increase.
Mean Pay
The mean is calculated by adding all employees’ hourly rates of pay together and dividing by the total number of employees. The mean includes the lowest and highest rates of pay.
The average hourly rate paid to women at the University, when looking at hourly rates across all pay bands is 3.8% less than the hourly rate for men - this is the mean gender pay gap.
This is significantly below the HE Sector average of 14.7% and the national mean gender pay gap of 17.3% (ONS Annual Survey of Hours and Earnings 2019) and is likely to be one of the lowest in universities.
As mentioned above, the proportion of women in quartile 1 increased between 2018 and 2019, due to an increase in the number of our female students undertaking paid work. This change has led to a small difference in the annual mean figures for 2018 and 2019.
Median Pay
The median is the measurement used to calculate the average pay, by finding the midpoint in all employees’ hourly rates of pay. Therefore, half of the employees will earn a rate above the midpoint and half will earn a rate below the midpoint.
The median gender pay gap at the University is 2.8%. When student employees are removed from this calculation, the median pay gap is -1%. The HE Sector average is 13%.
Bonus Pay
There were no staff bonuses paid in 2018/19.
Future plans
The University is committed to inclusion and the promotion of gender equality. Our gender pay gap data confirms we have good foundations in place and that women are well represented at all levels within our organisation.
We continue to keep our HR policies and processes under regular review to ensure we are making steps towards removing any existing gender pay gap and to ensure that there is a balanced representation of different genders within the workforce and across all roles.
We continue to monitor the employment ‘lifecycle’ of our staff; from initial recruitment ensuring that we have fair and consistent selection processes; having career development opportunities open for all job roles; clear and consistent promotion and salary processes; fair and flexible working practices.